- The Crosstab
- Posts
- Welcome to the Crosstab

After the success of my article on the response bias problems in public polling, I received a lot of encouragement to publish more frequently and thus the Crosstab was born. I would note two things: first I will publish when I can and can't guarantee a schedule; second, I am a terrible proofreader so please forgive the typos and grammar issues. So without further ado, the first edition of The Crosstab.
Public Polling Still Sucks
I probably could fill every issue covering why public polling remains just absolute unmitigated garbage but who would want to read that? So just to highlight a few pieces:
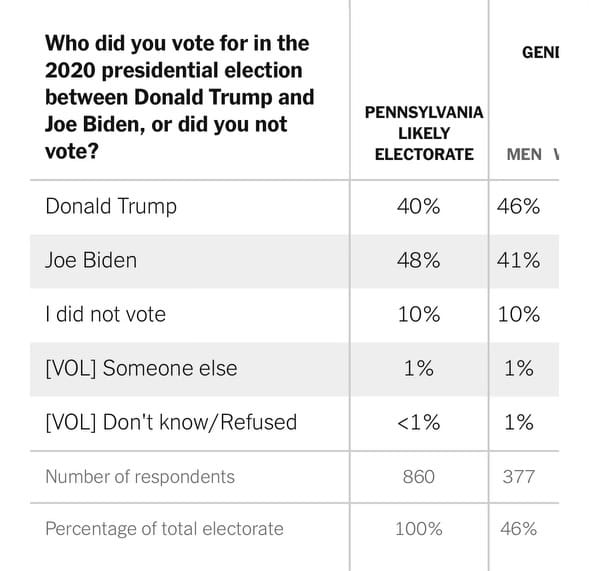
Recalled ballot - NYTimes/Sienna poll
Today’s NYT/Sienna poll has a recalled ballot of Biden +8 versus 2020. Now look I am not the type of person that thinks you should quota for this and set it at what the result of the 2020 election was and I am glad they are not herding. But logic would dictate this means a huge chunk of Trump 2020 voters disappearing from the electorate. While this is possible it seems relatively unlikely.
The question is why methodologically we might be seeing these problems? Again I suspect it is about rich, white, older voters absolutely flooding the screeners.

The dean of GOP data, Patrick Ruffini with some 🔥 this morning
Behind the Scenes: Response Issues Still Real
We’ve been running some tests on how to collect more interviews for our clients especially using text messaging. We launched some this morning testing language and thought it was
Text Messages Sent | 2,000 | 100% |
Successful Sends | 1,438 | 75% |
Link Clicks | 42 | 2.1% |
Completed Surveys | 3 | 0.3% |
So if you want to know why it is so hard to get good samples it’s that 0.3% response rate.
TV Rates are INSANE and campaigns are adapting
I’ve bought TV in Pennsylvania for almost two decades for campaigns. The rates this cycle are absolutely insane and in many cases 2x what people paid just a few years ago. Now broadcast television is priced in “Gross Ratings Points” or what people in the industry call ‘GRIPS’.
A gross rating point is the % of TV viewers who saw something x the number of times they saw it. In the simplest example, three hundred gross ratings points means roughly the average viewer saw the spot 3 times. (This is way oversimplified but gets the point across).
Anyway the Pittsburgh market is now around $450 cost per point which is up from $220 in previous elections to reach the same number of people. (And this is for candidates which get the lowest rates, outside groups are paying multiples of $450).
How are campaigns adapting? Buying a lot more digital. We’ll wait for the final analysis of FEC files and stations logs, but my guess is we will see a significant percentage shift away from linear TV and towards digital.